Dashboard
The Dashboard tab ![]() view is the first one you see if you log in with the link {server name}/admin/ (Example: mail.icewarp.com/admin/).
view is the first one you see if you log in with the link {server name}/admin/ (Example: mail.icewarp.com/admin/).
To see entire list of tabs, click the main menu  at the top left corner
 ![]() .
.

Figure. Dashboard tab.
General overview 
General overview includes real-time information like:
-
 Active users – number of active users within domains and their categories: Lite, Standard, Professional
 -
 Subscription plan – set of services provided
 -
 Total storage used – size of used disc space
 -
 Mail sent – number of email sent since server launch
 -
 Mail received – number of email received since server launch
 -
 Cluster – location of the cluster where your data is stored
Current Traffic 
Current traffic section allows to have a quick overview of the current traffic and provides graphical representation of data according to the parameters selected in drop-down menus.
-
Quantity of the server connections – SMTP / IMAP / POP3 / Web connections
-
Volume of processed data filtered by the following parameters:
-
Service: SMTP / POP3 / Web / Instant Messaging / GroupWare / IMAP / FTP
- Time period: Real-time / Last Hour / Last Day / Last month
- Category: Server data / Client data / Connections / Received / Sent
-
-
Button CANCEL returns all selected options to default setup.
Note: If you choose the Realtime parameter, in the Category menu Connections category will be automatically selected. Other categories will not be available.
Service status 
This section provides overview of the status of each service in detail. See Service Status.
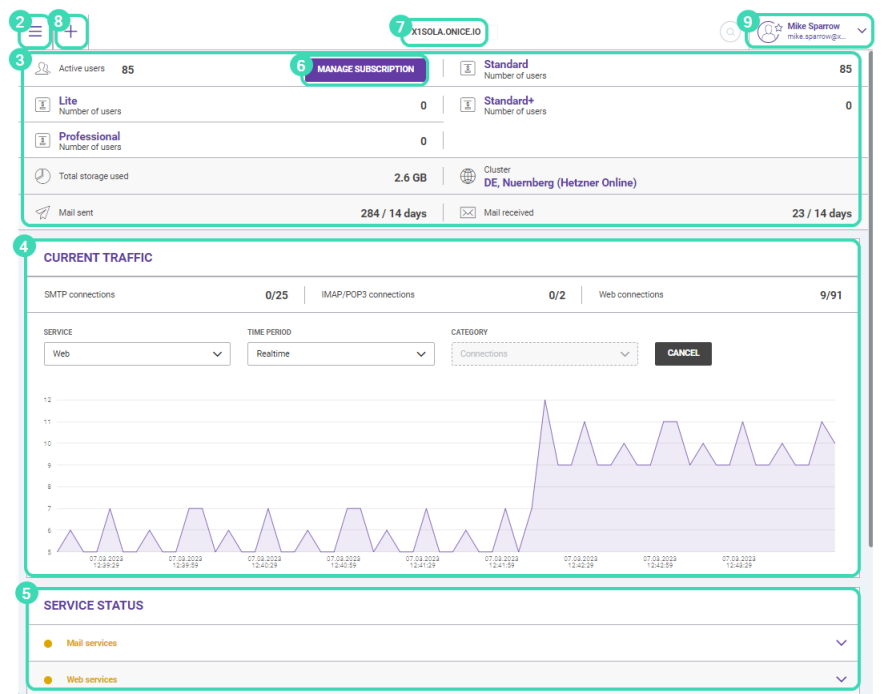
Figure. Dashboard view.
Other options
![]() Manage subscription button leads to information about subscription plans. See Subscription.
Manage subscription button leads to information about subscription plans. See Subscription.
![]() The cloud domain name. See Domain List.
The cloud domain name. See Domain List.
![]() Plus menu provides the list of new items you can create. See Plus Menu.
Plus menu provides the list of new items you can create. See Plus Menu.
![]() Your account details. See User Account Menu.
Your account details. See User Account Menu.

