System Monitor
System Monitor monitors various aspects of your server.
You can have alerts sent to a user if thresholds you define are broken. We recommend that this user is an administrator so he/she can access the system and fix, or suggest a fix for the problem.
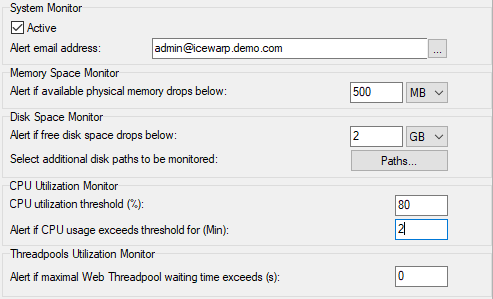
Figure. Tools management: System Monitor.
|
Field |
Description |
|---|---|
|
Active |
Check this box to activate System Monitor. |
|
Alert email address |
Alerts will be sent to the address(es) specified here Multiple addresses can be entered, separated by semicolons. |
|
Alert if available physical memory drops below |
Enter a non-zero value here to have an alert sent based on available memory. In the screenshot above, an alert will be sent if the available memory falls below 128 kB. |
|
Alert if free disk space drops below |
Enter minimum free disk space - figure which will be used as a threshold. When available space on the IceWarp Server installation directory disk falls below this figure, an alert will be sent to the alert email address. If the value is zero, no disk space monitor is applied. |
|
Select additional disk paths to be monitored |
The Paths button opens the diskspace.dat file where different values can be entered for different disk drives. Examples are included in the editor. Note: An alert is sent if any of paths has insufficient space even if the Alert if free disk space drops below value is set to 0. |
|
CPU utilization threshold |
Enter a non-zero value to indicate a CPU utilization threshold for alerts. If CPU usage is higher than this threshold for the length of time specified in the next text box, an alert will be sent. This applies also for multi-CPU/multi-core servers in the case only one os CPUs/cores is high. |
|
Alert if CPU usage exceeds threshold for (Min) |
The length of time the CPU utilization must break the threshold before an alert is sent. In the above screenshot, a CPU alert will be sent if the utilization exceeds 80% for more than 2 minutes. |
|
Alert if maximal Web Threadpool waiting time exceeds (s): |
Enter a waiting time after which an alert is sent. Web service has set some thread pooling (use the webserver.dat file). When this number of threads is met, other requests have to wait. Thread pool indicates how many php.exe processes can be used at the same time by WebClient. The default is 15. This option can tell you for how many seconds you are out of threads. For details check Web/Control logs in debug mode. |

