Traffic Charts
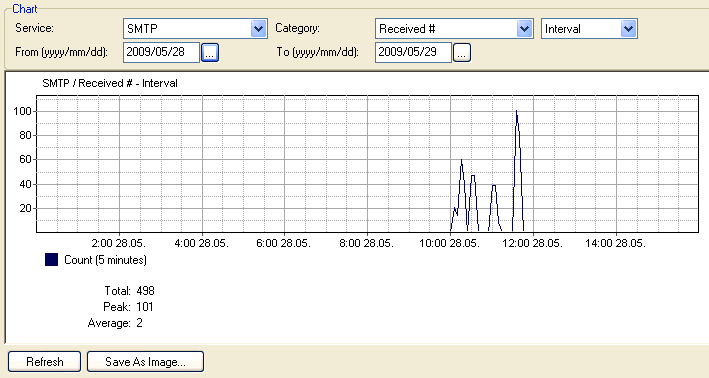
On this tab you can see charts of traffic on your server. You can choose not only particular services to be shown but different types of messages can be shown as well, e.g. Received or Sent etc. Of course, you can adjust the time period to be shown so you can see charts per day, per week or per month.
Traffic charts data is stored in .xml files within the <install_dir>/status folder.

Figure. Traffic chart example.
| Field |
Description |
|---|---|
|
Service |
Select the service you wish to display. |
|
Category |
Select the category of the shown data. e.g.: SMTP - Spam Refused #. |
|
<Interval> |
Select the interval for data revealing. (1 Day, 1 Week, 1 Month, specified interval) |
|
From/To |
Available only when Interval chosen. |
|
Refresh |
Click this button to reveal relevant data. |
|
Save As Image |
Click the button to save data currently shown. |
Note: You can zoom in into a selected area. Just mark this (rectangle) area using the left mouse button. To zoom out, click the Refresh button.
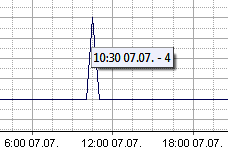
Tip: When hovering over a traffic chart, a tooltip is shown. It displays the current graph value at the place where a cursor is placed.


