Logging
If you have set the antispam logging options, you can browse the antispam logs to see what happened to a message, why it was marked as spam, or was not marked as spam.
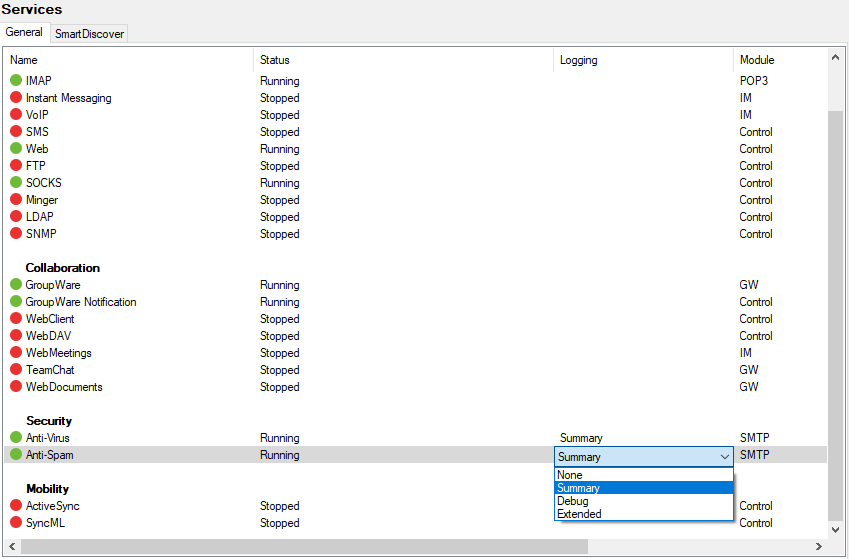
Figure. Services list.
Enable logging in the System > Services node of the administration console.
For more information, refer to the System > Services > chapter.
Figure. Display logs.
You can view your antispam logs upon the Status > Logs node. Select Antispam and Date from the appropriate lists. For detailed information, refer to the Status > Logs section.
The following is an example of a log entry with an explanation of each field:
Example
In this manual, the line is split but within the log screen it would be continuous on one line. The separate fields are described in the table below:
|
Field |
Description |
|---|---|
|
127.0.0.1 |
This is the IP address that IceWarp Server is connected to send/receive this message. |
|
[07B0] |
This is the identifier of the program thread that performed the work. |
|
11:22:54 |
The timestamp for this log entry. |
|
RSH57851 |
This is the ID of the message. |
|
'<john@doe.com>' |
The user who reportedly sent this message. |
|
'<webmaster@icewarp.com.br>' |
The user this message is intended for. |
|
1 |
The number of recipients this message was intended for. |
|
score 10.00 |
The spam score this message achieved. Note: This score has a maximum value of 10. The message may have achieved a score higher than 10 but IceWarp Server automatically sets it to 10 if this is the case. |
|
reason [SpamAssassin=10.00,Bayes=99.99,Body=PE] |
SpamAssassin=10.00 – A score from Spamassassin of 10.00. Bayes=99.99 – The probability that this message is spam, according to Bayesian filters. Body=PE:
|
|
action SPAM |
This is the action taken based on the spam score in this case SPAM meaning the message was marked as spam and processed accordingly. There are four actions which can be assigned:
|

